The mechanisms of SERS

© 2014 EPFL
Mode-selective surface-enhanced Raman spectroscopy (SERS) is demonstrated using plasmonic dipole antennas fabricated with electron beam lithography. An 10× change of the relative enhancement between two different Raman modes is observed when the resonance frequency of the plasmonic antennas is tuned over the Raman modes by varying the geometrical parameters of the antennas, i.e., changing their lengths or narrowing their feeding gaps. The comparison between the Rayleigh scattering spectra and the SERS spectra from the same individual plasmonic dipole antennas indicates that this mode-selective SERS phenomenon is a pure electromagnetic effect, providing a quantitative verification of the electromagnetic mechanism of SERS on a single nanoantenna level.
 Since the 1970s, it has been observed that the Raman scattering cross-section of molecules can be enhanced for several orders of magnitude when the molecules are adsorbed on a nanostructured noble metal surface. At the hot spots, such as nanojunctions in colloidal aggregates, the enhancement can even reach 10^(14), large enough to extend the sensitivity of this surfaceenhanced Raman spectroscopy (SERS) to the single molecule level, making SERS an ultrasensitive spectroscopic tool. Today, it is widely accepted that the giant enhancement observed in single molecule SERS measurements is mainly caused by the local electric field enhancement, described by the electromagnetic (EM) mechanism of SERS.
In this work, we use plasmonic dipole antennas to investigate how localized plasmon resonance (LPR) can alter the Raman spectra from nanogaps. As an efficient converter between farfield and near-field signals in the optical regime, a plasmonic dipole antenna provides an ideal model system to investigate the EM mechanism of SERS. It can enhance the electric field by 2 orders of magnitude in the gap at the resonance frequency and can also modify the radiation of a dipole emitter, such as a fluorophore, located in the feeding gap. Hence, a dipole antenna can influence the two key electromagnetic mechanisms of SERS: the excitation of the molecule and the emission of the Raman signal. Furthermore, the resonance wavelength of a plasmonic dipole antenna can be continuously tuned by changing its geometry. This unique feature enables us to perform a quantitative study of the relationship between LPR and SERS by using the so-called plasmon-sampled-SERS (PS-SERS).

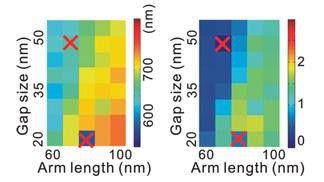
Figure 1: Spectral map of a 2D antenna array. Laser scanning confocal Raman mapping was performed over an antenna array. (a) The full Raman spectrum of the analyte (BCB) was collected at each pixel of the map. The net intensity of two Raman modes was calculated by integrating the signal covered by the green and red bars after background subtraction (the green and red dashed base-lines are determined with linear fits). (b) The intensity of the two modes was then plotted in one image using the green and red color channels, respectively. Therefore, the color changes from green to yellow and then to red due to the mixing of the two colors when the intensity ratio between mode 2 and mode 1 increases. The periodic bright spots indicate the antennas. (c) Intensity ratio of the two Raman modes on each antenna. (d) Measured resonance wavelength obtained from Rayleigh scattering spectra for the same antennas. (e) Prediction of the relative intensity of the two Raman modes using eq 1 based on the Rayleigh scattering spectra. In b-e, the red crosses indicate antennas with a non-Lorentzian LPR line shape.

Figure 2: Rayleigh scattering spectra and two surface-enhanced Raman modes of methylene blue molecules measured on the same single plasmonic dipole antennas. Spectra from dipole antennas with different arm lengths and a fixed gap size of 30 nm are shown in panel a. Panel b displays the spectra from the same single dipole antennas with a fixed arm length of 50 nm and different gap sizes. The wavelengths of the two different Raman modes are indicated by the two lines in the Rayleigh scattering spectra. The blue and red curves are the experimental data and the Lorentzian fits, respectively.
As shown in the left part of Fig. 2, the localized plasmon resonance (LPR) of the antennas exhibits a linear dependence of the resonance wavelength on the antenna length, consistent with simulation results reported previously.17 Red shifts are also observed when the gap size decreases, as shown in the right part of Fig. 2. Interestingly, when the gap size changes from 15 to 10 nm, the spectrum shows a sudden spectral jump over 100 nm. This can be explained by the fact that the resonance frequency is very sensitive to the gap size when the gap is smaller than 10 nm. Since the precision of electron beam lithography is limited to about 10 nm, fabrication inaccuracy can certainly produce large spectral variations when the gap size is designed below 15 nm.
These measurements provide a quantitative proof of the electromagnetic enhancement mechanisms of SERS.
Check the corresponding publication: PDF External link: doi: 10.1021/jp9042304