New maps chart our affective relationship with the local environment

Three EPFL researchers in Vernier: Aurèle Pulfer, Marco Vieira Ruas and Emmanuelle Agustoni. © Alain Herzog/EPFL
EPFL researchers have studied Vernier, a city in the canton of Geneva, as the pilot site for an interactive map that explores our relationship with the built and natural environments.
“Vernier is an odd place. You pass by oil storage tanks, an Ikea, and an airport – and then suddenly you’re walking by cows, the Rhône, and little boats.” That’s how one resident describes what he sees on his daily walking commute. He and 18 other residents took part in a study led by Atelier de la Conception de l'Espace (ALICE) and the GEOME research group within the Laboratory for Biological Geochemistry (LGB) – both part of EPFL’s School of Architecture, Civil and Environmental Engineering (ENAC). Lucía Jalón Oyarzun, Emmanuelle Agustoni, Aurèle Pulfer, and Marco Vieira Ruas have developed an open-access interactive map (available in French only) that incorporates affective aspects and geographic analyses.

Standard topographic maps show how to get from point A to point B. But what they don’t show are how we’re affected by the journey, how we perceive the environment along the route, and how all this affects our commuting choices and our physical and mental health. The ENAC researchers wanted to examine the relationship between our environment and our choices for active mobility, in order to create new frameworks for planning healthier, more resilient cities. “Our research is grounded in the affective and embodied aspects. We’ve turned the concept of the map into a lived experience of a given space, providing new ways of comprehending the invisible factors that influence our behavior,” says Agustoni, an architect at ALICE.

Walking and talking
The study is focused specifically on Vernier, the second biggest city in the canton after Geneva. Bordering the Rhône and sitting at the crossroads of national transportation routes, Vernier offers striking contrasts among neighborhoods that are heterogeneous and disconnected.
The researchers asked 19 volunteers of all age groups to describe a route they take daily to run errands, go for a walk, or drop their children off at daycare. Then a researcher – GPS and audio recorder in hand – accompanied each participant on a one to three hour walk along their route, collecting their stories and recording the path. “We asked them about their mobility habits while they were immersed in their everyday environment,” says Agustoni.
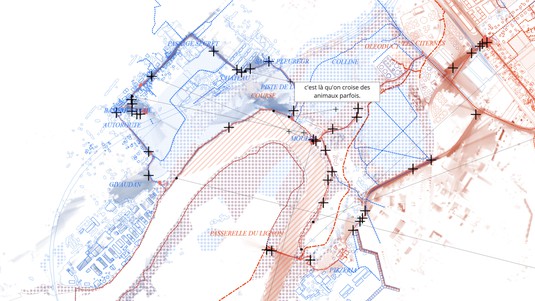
Our map gives us a much more granular understanding of the environment and creates spatial reference points that differ from conventional maps, which often make local neighborhoods seem homogeneous.
The information gathered on these walks was used to develop four layers of interactive filters for a new kind of map. The first layer shows the route; the second shows the view from the path; the third shows snippets of stories at the exact places where they were told; and the fourth shows significant places that the participant pointed out along the way. “The fourth layer is very interesting, because it creates an alternative geography of Vernier – the one the participant actually lives in,” says Agustoni. It also provides insight through all the placer he or she didn’t mention.” Pulfer adds: “Our map gives us a much more granular understanding of the environment and creates spatial reference points that differ from conventional maps, which often make local neighborhoods seem homogeneous.”
A second map, the Atlas des Paysages de Mobilité (“Atlas of Commuting Practices”), uses different filters to provide yet another, broader understanding of how Vernier residents move around. Informed by preexisting geographical data, the Atlas portrays pedestrians’ habits in the region and how they interrelate, based on a spatial analysis and the results of an open online survey that yielded more than 300 responses. Viewers of the Atlas can see different elements that encourage or hinder active transportation, like the end of a sidewalk, a dangerous intersection, or green spaces. “We can observe how these factors influence residents’ perception of their environment along with the effect this has on their everyday well-being,” says Vieira Ruas.
A holistic view
Such interactive maps provide a more holistic view of a given region. “A less normative, standardized view of a city can help urban planners better understand the reasoning and needs of local residents,” says Agustoni. “They can consider how residents really experience their environment and create opportunities for collective thinking.”
The researchers’ approach is just as valuable for residents as it is for city officials and urban planners. “It’s a testament to how intimately residents know their environment and how residents can play a role in a city’s transition to sustainability. Researchers, city officials and policymakers should listen to them,” says Vieira Ruas.

ENAC Interdisciplinary Cluster Grants
Office de l’urbanisme du canton de Genève