Mapping the blue ice in Antarctica from the sky

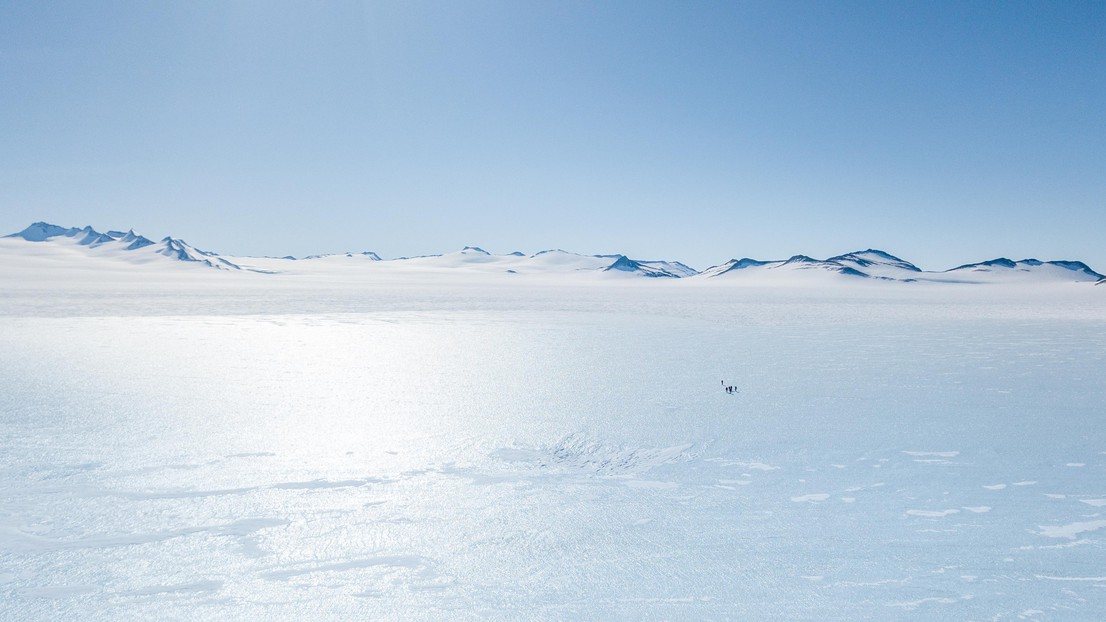
Fieldwork mission to Union Glacier, Antarctica 2022, in collaboration with antarcitca.cl (Universidad de Santiago Chile, USACH). © José Jorquera
Antarctica’s blue ice is a gold mine of information for scientists. Yet it’s scattered across areas making up just 1% of the continent’s surface – so it’s not easy to find. But now, researchers have generated a map of blue ice areas by combining artificial intelligence with satellite data.
[Article published in EPFL magazine Dimensions]
To the uninitiated, the Antarctic can appear chillingly monochromatic with its 14 million km2 of white ice. Yet look a little closer and you’ll see patches of light blue here and there, forming a striking contrast and offering unique photo opportunities for those brave enough to visit. Beyond their natural beauty, however, these blue ice areas (BIAs) are indicators of a hidden treasure: meteorites.
Blue ice is usually buried under hundreds of meters of white ice, but can appear at the surface if the white ice is eroded through abrasion, exposing the deeper layers of ice located near the underlying bedrock. Blue ice was formed through processes that in some places date back over two million years, meaning it’s ages old. Glaciologists in particular seek out BIAs because they provide an opportunity to sample old ice without the need for core drilling and to collect data on meteorites – providing key information on outer space – as well as on hard-to-reach terrestrial rocks. “Around two thirds of the meteorites retrieved on Earth come from Antarctic BIAs,” says Veronica Tollenaar, a guest researcher at EPFL’s Environmental Computational Science and Earth Observation Laboratory (ECEO) and a PhD student at the Université Libre de Bruxelles. Given how valuable BIAs are for scientists, and the fact that they account for barely 1% of the vast Antarctic surface, it’s easy to see how a map indicating precisely where they are could save researchers precious time.
Around two thirds of the meteorites retrieved on Earth come from Antarctic BIAs
Deep-learning model trained on satellite data
Tollenaar set out to create such a map by developing a deep-learning model and then training it on data from several satellites so that it could accurately recognize BIAs. She explains that the observations used were radar backscatter, surface morphology and elevation, as well as multispectral reflectance – a technique used to isolate individual wavelengths. Because Tollenaar’s model incorporates these different kinds of data, it isn’t subject to the biases that impaired previous efforts to map Antarctic BIAs; these biases result from temporary snow coverage and sensor-dependent conditions such as solar illumination angles and cloud cover. The existing BIA dataset used to train the model contained quite a bit of “noise” on the exact boundary of each area. But the model was eventually able to eliminate the majority of that noise, and its performance was further enhanced with a reduced set of “noise-free,” hand-labeled validation data.
“We’ve already gotten a lot of interest in the map from the various research groups here at EPFL that are studying snow and ice as well as meteorites,” says Devis Tuia, the head of ECEO.
Veronica Tollenaar, Harry Zekollari, Frank Pattyn, Marc Rußwurm, Benjamin Kellenberger, Stef Lhermitte, Maaike Izeboud, and Devis Tuia, "Where the White Continent Is Blue: Deep Learning Locates Bare Ice in Antarctica", Geophysical Research Letters, 2024.