Data analysis proves the existence of the Röstigraben

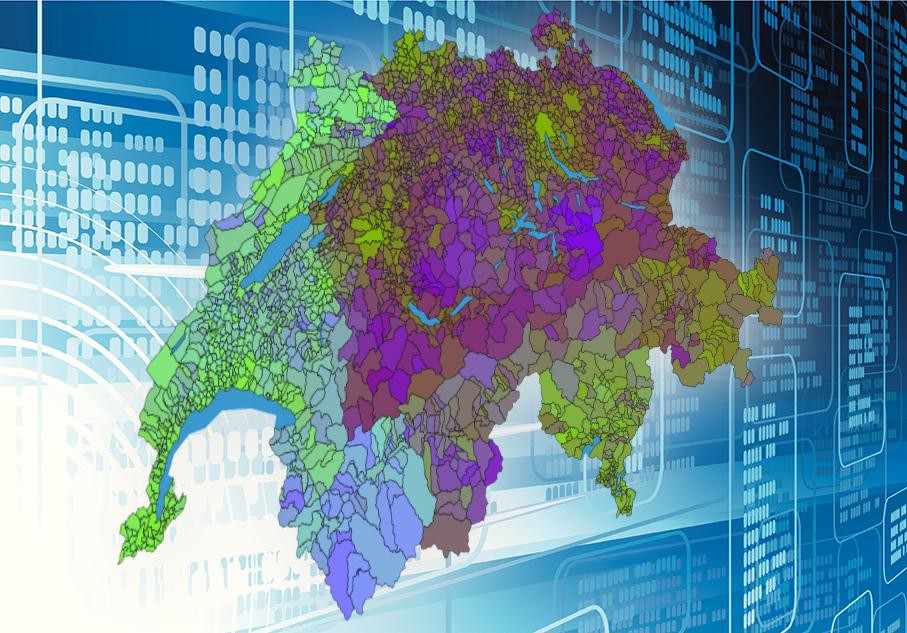
© predikon / Mediacom
Are the political parties really all that different from one another? Can politicians rig the vote in their favor by filling in their own profiles on the voting recommendation website "smartvote"? Two EPFL PhD students applied data analysis methods to information collected from the Swiss democratic system. Their results won them a “best paper award” in this year’s ACM Conference on Online Social Networks, held in Dublin, Ireland. Their next goal is to predict the outcome of a vote using partial results along with data from preceding ballots.
Swiss democracy produces lots of data: municipality-by-municipality ballot results and the votes of the National Council are publicly available, as are the responses of the candidates and voters who filled in the questionnaire on the "smartvote" voter recommendation website before the 2011 Federal elections. Under the supervision of professors Matthias Grossglauser and Patrick Thiran, Vincent Etter and Julien Herzen, PhD students in the Computer Communications and Applications Laboratory, explored these data to reveal a number of interesting facts. They are currently continuing their research by creating a platform, Predikon.ch, that will be able to predict the results of a federal vote based on initial results coming in from municipalities and past data.
Yes, the “Röstigraben” exists! “And it was a bit of a surprise,” admits Etter. They performed a dimensionality reduction on the municipal results for all votes since 1981. This is a standard tool used by statisticians who specialize in data analysis to produce a graphical representation of data. Two groups emerged: one French-speaking and one of German-speaking. (You can see it at http://www.predikon.ch/fr/habitudes-de-vote/langue). “The municipalities closest to the intersection of the groups on the graph are also those that are geographically closest to the linguistic border,” notes Herzen.
While the linguistic divide is easy to see on this representation, it’s a bit more difficult to make sense of the graph’s axes, obtained by the dimensionality reduction. “It’s not the traditional left-right and conservative-liberal divisions,” explains Etter. Over time, the Italian-speaking regions seem to move away from the French-speaking districts to join their German-speaking compatriots. In a future version of their interactive graphic, the scientists plan to add a temporal cursor that will highlight this.
Right and Left are alive and well
Although the Röstigraben can’t be explained by either the left-right or conservative-liberal divide, these classical political categories are alive and well when it comes to politicians, as the duo found when they applied the same data visualization tools to information from the 2011 Federal elections obtained from the voter recommendation website smartvote.ch.
With the same data analysis approach, the researchers explored whether the political parties were really all that different from one another. They showed that the positions of 25.8% of the socialist candidates were closer to the median of the green party positions than to their own party’s position. Inversely, the proportion was 18.8%. But the overlap was greatest in the PBD, with more than half of its politicians closer to the median of another party (most often the PDC, 33.1%) than aligned with their own.
Etter and Herzen also showed that it would be easy for a candidate who filled in his or her own smartvote profile to choose responses that would optimize the number of times they would be recommended to voters that trusted the site. However, this was evidently not exploited in 2011, since the difference between the voting records of parliamentary politicians and their smartvote profile was very small.
Ebikon, a small town that has it right
The next step for the two computer scientists is to predict the result of an vote by combining the initial votes coming in from a small number of municipalities with the database of past results. The platform they are developing with Victor Kristof, a student in Communication systems, is called Predikon.ch, a combination of the words “Prediction” and “Ebikon.” This small town near Lucerne (population 12,000) appeared in their preparatory studies to be the one whose results most reliably predicted the federal result. “By doing the exercise with past votes, in 96% of the cases, the result in Ebikon gave us the correct result at the federal level,” explains Herzen.
The project’s development is hampered by the fact that each of Switzerland’s 26 cantons has a different system for presenting its data, and that often these platforms are only online for a few hours the day the vote is held, while ballots are still being counted; but nonetheless there’s a good chance that the Predikon index will soon be mentioned in the news updates on these Sundays.
The Predikon project, along with all of Etter and Herzen’s research, will be presented at the School of Computer and Communication Sciences Open House, Saturday November 22 at 3:30 pm in room BC420, during a seminar entitled “La démocratie suisse vue par les données.” Throughout the Open House, a Predikon demo will be held on the fourth floor of the BC building. Register for the Open House online by November 20 at ic.epfl.ch/portes-ouvertes.