Tip-enhanced SERS

© 2014 EPFL
We present a systematic numerical investigation of conical metal tips which are commonly used in tip-enhanced Raman spectroscopy (TERS). Different from previous studies, we focus on how the tip length and the illumination condition influence the local field enhancement at the tip apex, and provide a useful reference for real experiments. In particular, we show that the type of illumination has a dramatic influence on the field enhancement: a localized illumination spot—as used in experiments—producing a very different response than a plane wave illumination—as usually used in previous models. Also, the effect of the different geometrical parameters, such as the sharpness of the tip apex and the cone angle, provides guidance to optimize the tip design. Finally, we investigate the influence of the substrate and compare numerical data with results deduced from a simplified model, finding good agreement. This brings new insights into the enhancement mechanism of TERS.
In this work, we conduct a systematic numerical investigation of conical metal tips which are commonly used in tip-enhanced Raman spectroscopy (TERS). Different from previous studies, we focus on how the tip length and the illumination condition influence the local field enhancement at the tip apex, and provide a useful reference for real experiments. In particular, we show that the type of illumination has a dramatic influence on the field enhancement: a localized illumination spot - as used in experiments - producing a very different response than a plane wave illumination - as usually used in previous models. Also, the effect of the different geometrical parameters, such as the sharpness of the tip apex and the cone angle, provides guidance to optimize the tip design. Finally, we investigate the influence of the substrate and compare numerical data with results deduced from a simplified model, finding good agreement. This brings new insights into the enhancementmechanism of TERS.

Figure 1: Tipmodel used for the simulation. Panel (a) shows the triangular mesh at the tip apex. The tip geometry is described in panel (b). Panel (c) shows the focused beam used for illumination.

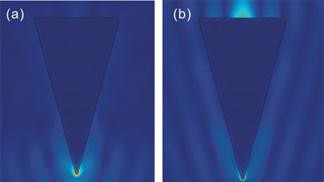
Figure 2: Electric field intensity maps of a truncated tip under different illuminations. Panel (a) and (b) represent illumination by a focused beam and a plane wave, respectively. Tip length l = 2000 nm, tip angle a = 15? and tip radius r = 20 nm.
These simulations indicate that the type of illumination has a determinent influence on the response of the system and plane wave illumination often produces results that are far from the experimental reality.
Check the corresponding publication: PDF External link: doi: 10.1002/jrs.2439