Near-field and far-field of plasmonic Fano systems

© 2014 EPFL
The relation between the near–field and far–field properties of plasmonic nanostructures that exhibit Fano resonances is investigated in detail. We show that specific features visible in the asymmetric lineshape far–field response of such structures originate from particular polarization distributions in their near–field. In particular we extract the central frequency and width of plasmonic Fano resonances and show that they cannot be directly found from far–field spectra. We also address the effect of the modes coupling onto the frequency, width, asymmetry and modulation depth of the Fano resonance. The methodology described in this article should be useful to analyze and design a broad variety of Fano plasmonic systems with tailored near–field and far–field spectral properties.
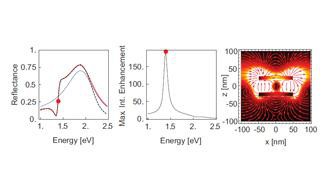
Fano resonances are visible in the far-field response of a plasmonic system as a characteristic asymetric lineshape. Yet, this response finds its origin in the near-field of the structure, where an interference is produced between a bright and a dark mode. The relationship between the near-field and far-field response of a typical plasmonic system supporting Fano resonances was studied in detail in a recent publication. We demonstrated that specific features visible in the asymmetric lineshape far–field response of such structures originate from particular polarization distributions in their near–field. We furthermore extracted the central frequency and width of plasmonic Fano resonances and showed that they cannot be directly found from far–field spectra. We also addressed the effect of the modes coupling onto the frequency, width, asymmetry and modulation depth of the Fano resonance. The methodology described in this article should be useful to analyze and design a broad variety of Fano plasmonic systems with tailored near–field and far–field spectral properties.

Fano resonance in a array of dolmen–type gold nanostructures. (a) Sketch of the structure, dimensions: w = 40 nm, l0 = 160 nm, t = 80 nm, g = 30 nm and l = L = 300 nm. (b) Reflectance at normal incidence for an x–polarized electric field propagating in the −z–direction, as a function of the illumination energy. Black dashed line: numerical simulations; thick red solid line: fit with Eq. (3); thin blue solid line: bright mode resonance extracted from the fit [Eq. (1)]. (c) Maximum intensity enhancement as a function of the illumination energy. (d) Normalized intensity enhancement in a plane through the center of the structure (z = 0, colorscale: black → 0 and white → 1). (e) Normalized amplitude of the z–component of the instantaneous electric field 5 nm above the structure (colorscale: blue → -1 and red → 1). (f) Normalized intensity enhancement in a x = 200 nm plane (colorscale: black → 0 and white → 1).
Check the corresponding publication: PDF External link: doi: 10.1364/OE.19.022167