Containment measures avoid 200,000 hospitalizations in Italy

Piazza della Loggia, Brescia, Italy, 12 March 2020 © iStock
Researchers have modeled the effects of containment and social distancing measures implemented by the Italian government to prevent the spread of COVID-19. Their findings show that contagion transmission was reduced by 45% in March. The model will now be used to analyze possible future scenarios.
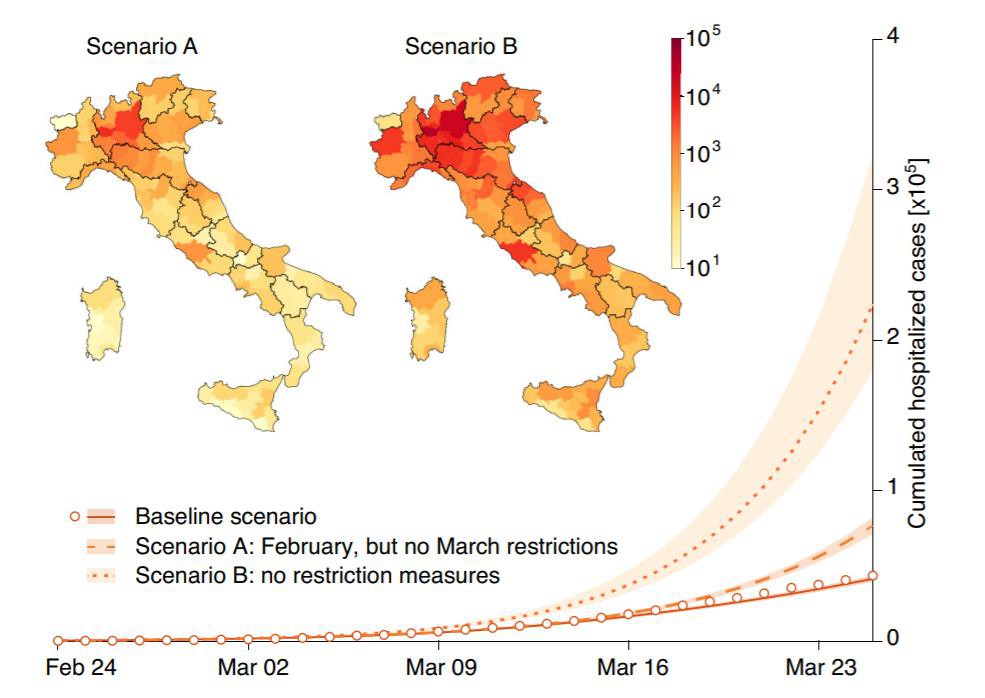
Since the beginning of the COVID-19 pandemic, mobility restrictions and social distancing measures implemented by the Italian government have avoided at least 200,000 hospitalizations and, over time, reduced contagion transmission by 45%. These findings were published recently in the journal PNAS. The paper is co-authored by Professor Andrea Rinaldo, who heads EPFL’s Laboratory of Ecohydrology (ECHO), and scientists from the Polytechnic University of Milan, Ca’ Foscari University of Venice, the University of Zurich and the University of Padua.
“We can conclude that the drastic measures taken by the Italian government have had a decisive effect, preventing the country’s healthcare system from becoming overwhelmed,” say the authors.
 Caption: Chart showing the expected number of hospitalizations under different scenarios. The baseline scenario shows the spread of the epidemic with all implemented containment measures in place. Scenario A reflects the February restrictions only, while scenario B corresponds to no restrictions. The maps show expected increases in hospitalizations by province over and above the baseline scenario. / M. Gatto et al., PNAS, 2020
Mathematical model
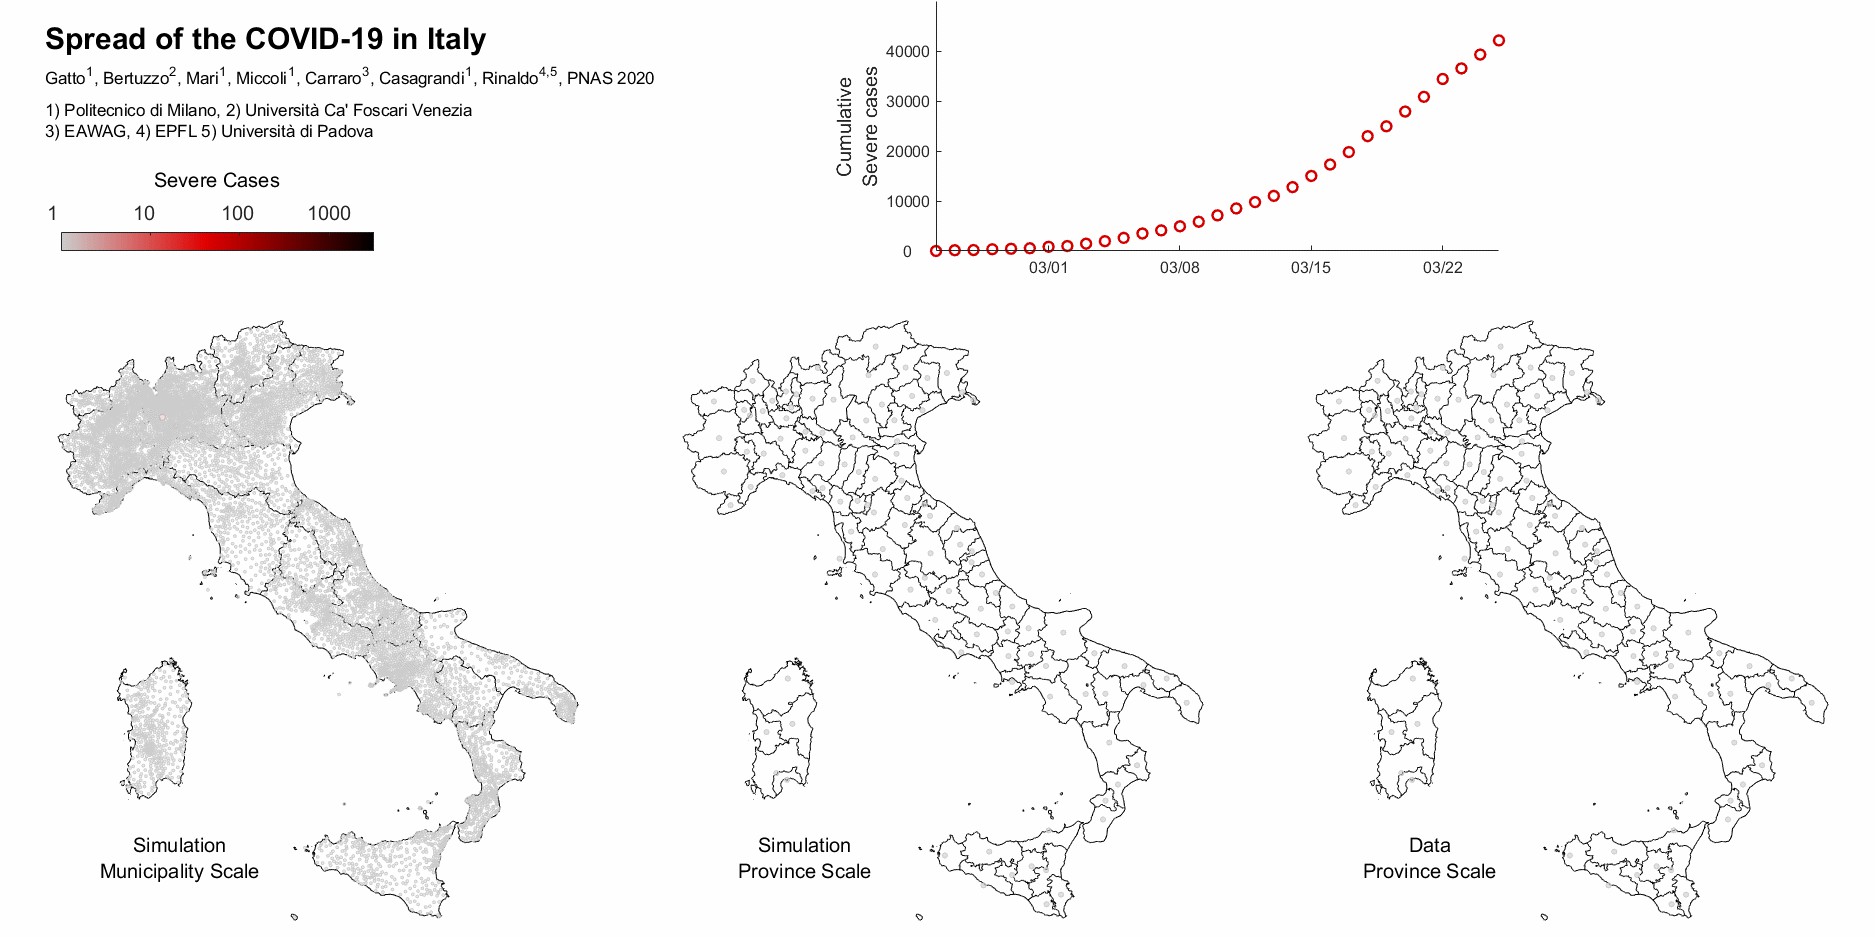
The researchers modeled the spread of the COVID-19 epidemic – which has since been declared a pandemic – in Italy, looking at the number of people hospitalized with the disease and the number of reported deaths between the outbreak in Italy and an arbitrary cut-off date of 25 March. What makes this study both important and unique is its spatial resolution. The disease-spread geography is modeled in 107 provinces and metropolitan areas – the most granular level of detail available.
The team calibrated the model to account for human mobility, using census data from Italy’s National Institute of Statistics to estimate pre-epidemic mobility, and the findings of an independent study based on cell phone geolocation data to ascertain the extent to which the government-imposed restrictions had reduced people’s movements.
After confirming the model’s accuracy by comparing the map of infections with observed data, the researchers used it to study the effects of the early containment measures.
 Caption: The map on the left shows the spread of the epidemic as simulated at the municipal scale. The other two maps show the geography of the epidemic as simulated by the model at the province scale (center) and as observed in data (right). / M. Gatto et al., PNAS, 2020
The model also suggested that as many as 600,000 people may have been infected with the coronavirus in Italy by 25 March, including many asymptomatic cases – well above the official figure of 74,386.
The researchers highlight the important role that infected but asymptomatic cases play in spreading the virus, calling for mass swab-testing campaigns to identify and isolate pre-symptomatic individuals. They also suggest that better contact tracing and localized restrictions could help stop the spread of the epidemic while limiting social and economic disruption.
Intervention strategies
Andrea Rinaldo, a recipient of a European Research Council (ERC) Advanced Grant Fellowship and a full professor at EPFL, has over a decade’s experience in epidemic modeling. His past research findings have been used by the World Health Organization (WHO) and Médecins Sans Frontières (MSF) to develop intervention strategies to limit the spread of cholera and other waterborne diseases.
Prof. Rinaldo was keen to get the COVID-19 study up and running as quickly as possible, so he reached out to colleagues who had previously worked at his lab. “I recruited former PhD students and postdocs and a visiting professor virtually overnight,” he explains. “By repurposing technologies we’d worked with in the past, we were able to develop the new model in next to no time. Our paper demonstrates that the model is a reliable evidence base for emergency planning. But that’s only the start. Our next step will be to use it to analyze future scenarios.”
Timeline of restrictions in Italy
21 February: The first COVID-19 case is confirmed in Lombardy.
23 February: Ten municipalities in Lombardy and one in Veneto, identified as infection hotspots, are put under strict lockdown. Businesses and schools are closed and public events are canceled.
8 March: The whole of Lombardy and 15 provinces in northern Italy are put under lockdown. Social distancing measures are implemented across the rest of the country. A media leak of a draft bill outlining these measures causes panic, prompting some people to leave northern Italy and head to other parts of the country.
11 March: The lockdown area is extended and severe restrictions on movement are introduced nationwide
Spread and dynamics of the COVID-19 epidemic in Italy: Effects of emergency containment measures. Marino Gattoa, Enrico Bertuzzo, Lorenzo Mari, Stefano Miccoli, Luca Carraro, Renato Casagrandi and Andrea Rinaldo. PNAS, 23 April 2020. DOI: 10.1073/pnas.2004978117
Images to download