WiFi breadcrumbs reveal pedestrian patterns

© 2016 EPFL
By using anonymized WiFi data collected on campus, EPFL researchers were able to analyze students’ motivations in a fundamental activity: eating. More broadly, this method offers a low-cost way of studying pedestrians’ comings, goings and destinations.
Pizza or pasta, Thai or Indian, quick burger or sit-down restaurant? On a campus with a population of 13,000, there is no shortage of eateries. How do people choose one? Setting aside the traditional survey approach, EPFL researchers looked at the traces left by pedestrians as they passed WiFi access points. These virtual stones deposited by streams of people are worth their weight in gold when it comes to understanding and predicting the behavior of people who use the pedestrian infrastructure. Provided we can read the data, that is.
Antonin Danalet, a researcher in the Transport and Mobility Laboratory, chose EPFL's campus as his testing ground. He recorded more than two million points picked up by the campus’s 789 WiFi antennas. Data was collected over 10 days in mid-2012. “WiFi traces are cheap and easy to obtain, but they do not mean much on their own,” said the researcher. For one, they are vague. While they indicate how much distance was covered in how much time, they do not on first glance give any insight into the route people took or what they did once at their destination. The aim of Danalet’s thesis was to make this data talk.
With the help of the school's IT service, he was able to link the points he collected with individuals – around 2,000 in all – in order to give them meaning. “The data was anonymized,” he said. “I only knew if the traces came from an EPFL student or staff member. If it was a student, I also knew the section and year.”
Observing pedestrians’ behavior
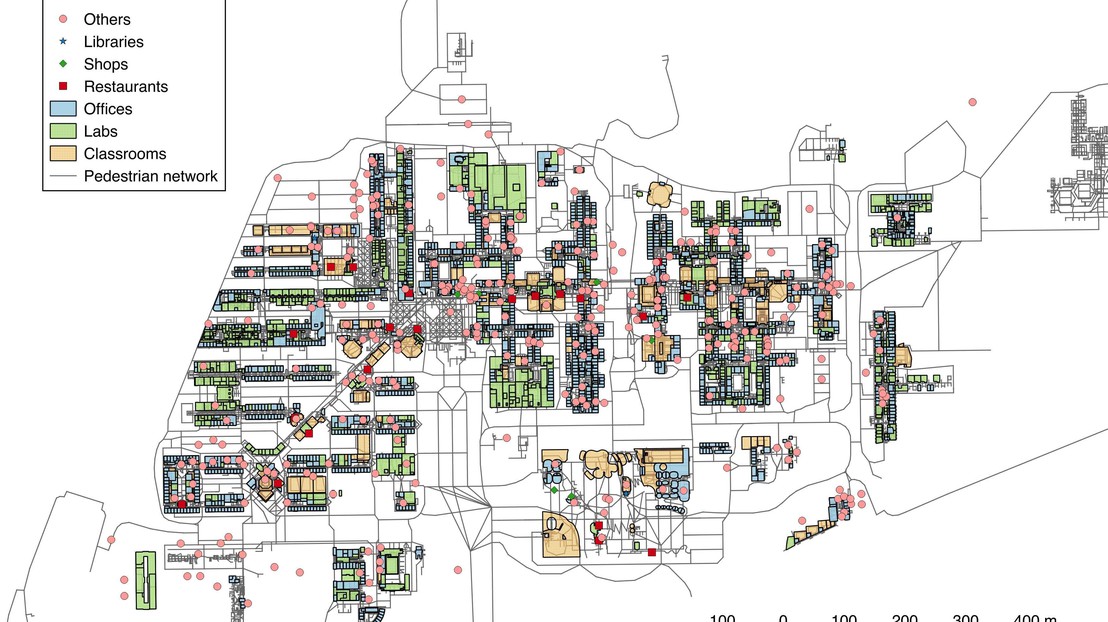
To understand the individuals’ successive destinations, Danalet merged WiFi location data with map data. By using the campus map and its pedestrian walkways, he was able to reconstruct routes and identify when the pedestrians reached their destination, how long they spent there and what they did. The researcher also superimposed data on the use of the campus’s rooms – by taking the occupancy rate of classrooms as determined by class schedules, for example – as well as data on the number of purchases made at the various eateries, which gives the number of people who pulled out their wallet at a given time on a given day.
“We have statistics and numbers on people who drive and take the train, but pedestrian behavior is often a mystery,” said the researcher. “These observations would come in very handy for understanding the use of pedestrian infrastructure at music festivals, museums and hospitals, for example.”
To verify the accuracy of his model, Danalet compared it to the comings and goings of an actual person: himself. “This allowed me to correct any biases in the model,” said Danalet. Another cross-check: “We compared the WiFi traces to the results of a survey asking students when they arrive on campus and when they leave.” The result? According to the WiFi traces, students arrive in the morning on campus around half an hour later than they report in the survey. “Do they turn on their phone a half hour after arriving on campus, or were they trying to look good for the survey?” wonders the researcher. “We have no idea. But psychologists refer to the second hypothesis as social desirability bias.”
Price and proximity determine where people eat
In addition to people’s comings and goings, the WiFi traces can also provide some insight into the choices they make. For example, why they choose one restaurant over another on a campus with 21 choices (back in 2012). The researcher assigned a score to each eatery on campus. He included various criteria, such as price, size, proximity, the annual quality rating, the food served and the opening hours. Danalet then applied the WiFi data – such as where the architecture student prefers to nosh – to identify the most important factors. Not surprisingly on a campus, price is a key factor. But it’s not the only one. Proximity is also very important, as is size: the larger the eatery, the faster the line. The type of food does not have much bearing, it turns out.
Danalet offers this conclusion: "This model is appealing because it can predict changes in what people do and where they go as a function of changes in the choices presented to them. What will happen if the price of the daily special goes up? Where will the cost-conscious go? And what sort of impact will a new eatery have? This type of pedestrian behavior model is important for designing – or improving – pedestrian infrastructure at places like train stations, airports and shopping centers. These models can also help identify the best spot for things such as a cash machine or bakery.”

