Plotting Pokémon Go's success

© 2016 EPFL
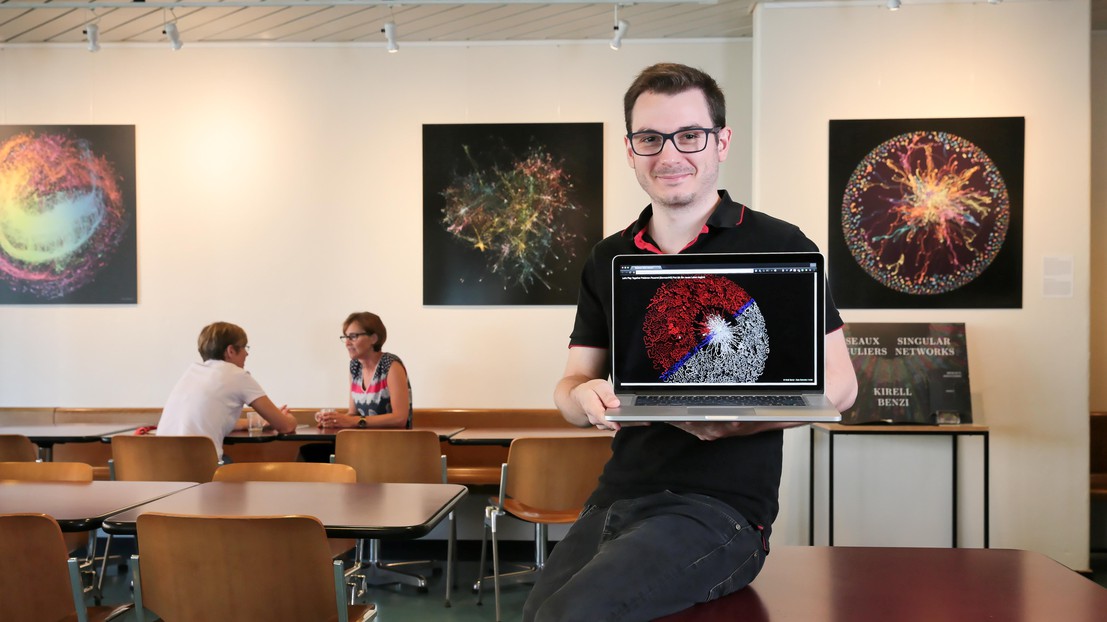
Since the popular game came out this past summer, the number of videos about it on YouTube has skyrocketed. In a demonstration of the incredible power of network modeling, Kirell Benzi, a PhD student at EPFL, catalogued them all and plotted them in a 3D interactive table.
Math is providing us with some new tools made possible by advances in computing power and developments in the field of artificial intelligence. They can do what the human brain cannot: quickly and accurately process huge amounts of digital information, such as the content of thousands of pages of webpages devoted to the same topic, data collected by a telescope observing a distant galaxy and the reactions of social media users. In addition to sorting and structuring all this information, these algorithms can give it visual shape – using graph theory – to help us interpret it.
Kirell Benzi, who is finishing his doctoral thesis at EPFL’s Signal Processing Laboratory (LTS2), puts these tools to work to reveal new and often surprising patterns. After discovering unsuspected dimensions of the Star Wars saga, he is now focusing his analytical acumen on Pokémon Go.
Since this highly popular game came out this summer, the number of new videos posted on YouTube with the word ‘Pokémon’ in their title or description has simply skyrocketed. There were more than 25,000 after just two weeks and nearly 50,000 after a month, with more than seven billion views. Using Pokémon Go playlists, Benzi collected all of them – from the simplest to the craziest, from the most serious to the most bizarre – in all languages. He then plotted them in a virtual 3D interactive table. Each of the 47,927 videos catalogued at the time of the study is represented by a point – a node – that is connected to other nodes with respect to the playlist they belong to. Clicking on a node brings up the video.
Studying virality
“The point of my work is to use the incredible success of this game to study how something goes viral,” says Benzi, whose thesis deals with graph theory and network modeling.
Now that he has collected all the videos on Pokémon Go, Benzi can move to phase two. He wants to analyze them to identify various parameters: what is the profile of the viewers, where are they from, what are they looking for, how does the information spread and via what channels, how do they change over time, how fast, and how do they create individual YouTube celebrities?
But Benzi doesn’t just use his math for scientific analysis. This inventive and multifaceted researcher applies the many network models he has developed for his thesis to more artistic ends as well.
He created an unusual exhibition – Singular Networks – that is designed to pique the general public’s interest in fundamental scientific issues. It was on display for three months in the art gallery of the ELA building on EPFL’s campus.
Encouraged by viewers’ feedback, Benzi now intends to expand his work to include other data sets and to share his passion for networks with a wider audience. His works will be on display during EPFL’s Open House on 5 and 6 November and on the top floor of EPFL’s BC building in February 2017. The exhibition will then travel to Paris and London in late 2017.
Information on his work and art is available on Facebook (https://www.facebook.com/kirell.benzi/), Twitter (https://twitter.com/kikohs) and his blog (http://kirellbenzi.com/).
For more on his work on the Pokémon Go videos:
http://kirellbenzi.com/blog/gotta-catch-em-all-a-pokemon-data-viz/