Getting a handle on chronic pain

© 2012 Photos.com
Chronic pain has a significant impact on the physical, social and emotional functioning of those who suffer from it. It is also notoriously challenging to diagnose and treat, because pain is such a subjective experience. Scientists at EPFL (Ecole Polytechnique Federale de Lausanne) have developed a new tool that will give doctors an objective way to evaluate a patient’s pain level. This in turn will enable them to tailor more targeted treatments and monitor their effectiveness over time.
How we move is an excellent indicator of overall health. When we feel good, we move around continually. When we’re in pain, we reduce our physical activity. This observation might seem trivial, but it has led to an original approach for evaluating chronic pain. A team from EPFL’s Laboratory of Movement Analysis and Measurement (LMAM) has developed a clever, easy-to-use visual tool to help doctors assess their patients’ pain levels. The research appears online February 23 in the journal PLoS One.
“Movement is an objective indicator of pain. You move differently if you’re in pain than you do if you’re completely healthy,” explains EPFL scientist Anisoara Ionescu. “It’s important for doctors to be able to evaluate that pain as precisely as possible.” Using data collected by sensors placed on different parts of the body, she explains, a doctor can quantify a patient’s suffering, monitor progress and adapt treatment appropriately.
Doctors typically try to assess the severity of chronic pain with an in-depth oral evaluation using a series of standard questionnaires. This method, however, gives a very static view of the patient’s condition – how he or she felt on this day, at that time. There are other problems with this approach as well. Patients rate their pain on a scale from 1 to 10; but obviously we don’t all feel a “5” in the same way. And some patients, such as children or the cognitively impaired, are simply unable to describe or communicate their pain at all.
Movement as an indicator
The EPFL study monitored the physical activity of 15 healthy, pain-free subjects and 60 patients suffering from chronic pain. Sensors equipped with gyroscopes and accelerometers were attached to their chests and adjacent to their knees and ankles. The sensors recorded all the subjects’ movements and periods of rest. The result: those who reported chronic pain moved differently than the healthy subjects; in particular, their active periods were punctuated by numerous brief rest intervals. Using the new tool, the researchers were able to take data several days before, during and after treatment. Results from the different periods could be compared to obtain a precise assessment of how the treatment changed a patient’s day to day activities.
“There is definitely a difference in behavior between healthy and chronically ill patients,” says Dr. Eric Buchser, a professor at the hospital in Morges, Switzerland, who is participating in the study. “But we’re just starting to collect data. We still need to gather more and establish objective reference values between patients.”
Pain – in all its manifestations
The LMAM laboratory has been working with the department of anesthesiology and pain management at the Morges hospital, which Buchser heads, for ten years. “Our first studies focused on acute pain, and then we moved to the more persistent, nagging suffering known as chronic pain. However, we had very little objective information on the intensity of this kind of pain.”
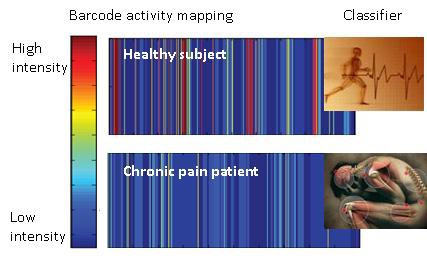
Walking, running, sitting, and lying down are all objective indicators. The scientists defined 18 different activity states: various combinations of activity type, intensity, duration, and how the activity is distributed over time. They used the temporal sequence of these different states to develop a visual tool, a kind of color ‘barcode,’ that would be easy for doctors to use on a daily basis. The structural complexity of the barcode was an indication of pain intensity. In a single glance, a doctor can see a patient’s situation, his or her progress, and the effect of an applied treatment protocol. Buchser has high hopes for the tool. “Eventually, the doctor could use this physical activity “barcode” to help make a diagnosis, better target a therapy, evaluate its effectiveness, and adapt it appropriately over time.”